Beginner’s Guide to Google Analytics Reports
So, you’ve got all this insightful data at your fingertips. But what is it? Google Analytics Reports can look confusing if you don’t know what they mean. In this article, we’ll be covering the basics on how Google Analytics categorizes its data reports.
By now you should know what Google Analytics is, how to install it and how to set your own business goals. If you don’t, you need to check out our previous blog posts;
- – Getting Started: What is Google Analytics?
- – How to Setup Google Analytics
- – How to Set Goals with Google Analytics
Google Analytics Reports are split in to;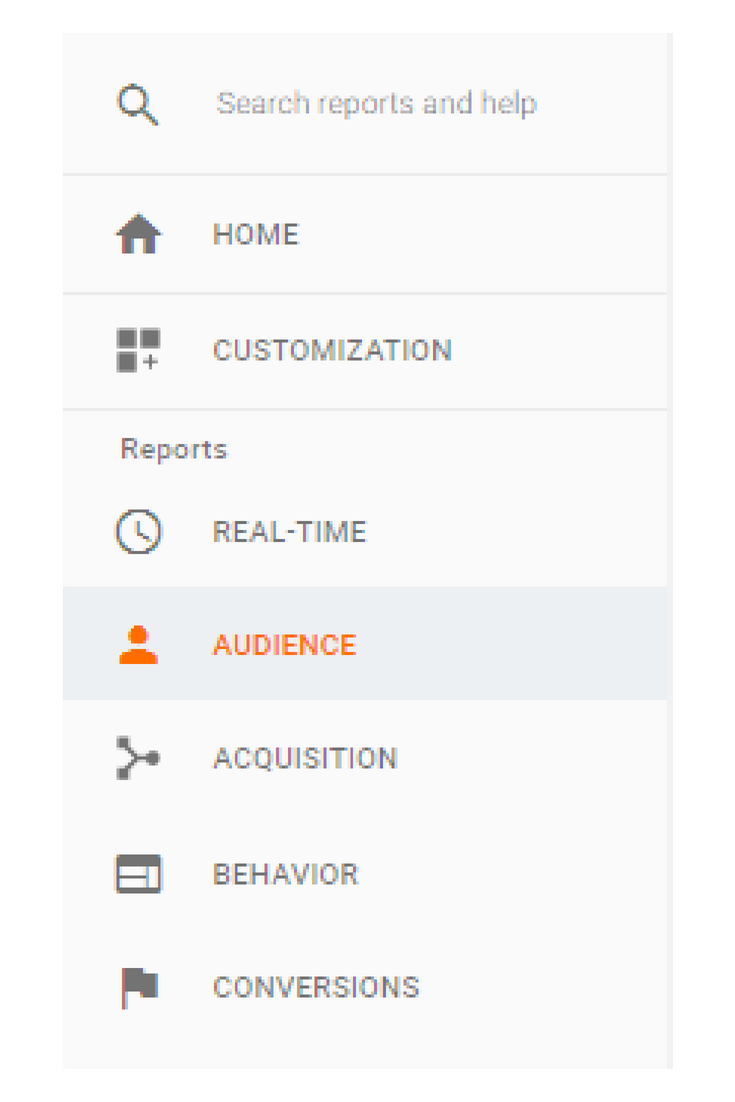
- – Real-Time
- – Audience
- – Acquisition
- – Behaviour
- – Conversions
Google Analytics Reports – Real-Time
As the title suggestions, you’ll be able to monitor activity on your site that is happening at present.
Access current data, for example …
- – Who is on your site currently
- – What pages are they visiting and interacting with?
- – If any goal conversions have been completed
Real-Time Reports are particularly useful to assess the success of marketing campaigns on your website traffic. You’ll be able to quickly see if your efforts have been successful in driving visitors.
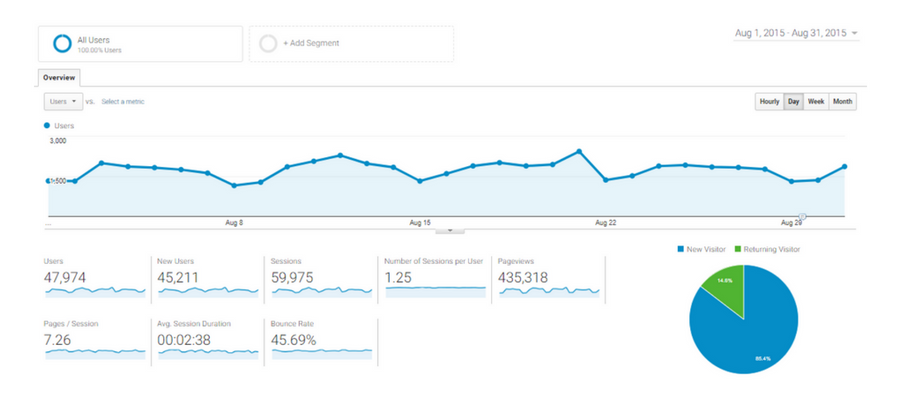
Google Analytics Reports – Audience
Your Audience Report will help you to understand the characteristics of your users. With this data, you’ll have an insight into your typical customer. To help you tailor your marketing, website and services to your audience, check out our blog post, “Who is Your Business Avatar?”
Without going in to extensive detail; here’s a few on the insights you can expect to see;
- – Active Users
- – Lifetime Value; how important different users are based on their performances on your website
- – Cohort Analysis; the common characteristics of your users
- – User Explorer; assess individual user behaviour
- – Age and Gender Demographic
- – Interests
- – Geographical Location and Language
- – Behaviour; how many people are new, returning, frequent and recent visitors
- – Technology; what browser, operating system and network did users use to reach your site
- – Mobile Device; the different mobiles used to reach you
If you want to look at Audience Reports in more detail, head over to Google Analytics Help.
Google Analytics Reports – Acquisition
Acquisition plainly means how people visit your site; Google Analytics will monitor how the traffic arrives to your site.
A few examples of the sources to the traffic you’re getting could be;
- Generic Paid Search; found your website through a general query
- Branded Paid Search; precise queries relating to your company i.e. searching for your company name
- Referral; visiting your site from outside a search engine
- Organic; reached your side not by paid advertisement
- Direct traffic; can be from typing your URL in the search bar
- Social; traffic from social networks like Facebook, Instagram and Twitter
- Display; through visuals like banners
- Email; through email communications
Acquisition reports are a fantastic way to see which of your marketing efforts are brining traffic to your website. It could also help you to decide where you’re making the most impact and what styles of marketing you suit your needs.
Let’s take a look at an example …
Referral Traffic; Discover which referrals are pushing the most traffic to your site. For example, if Facebook is responsible for the majority of your referral traffic, you may want to consider dedicating more efforts on to Facebook marketing to boost your traffic even further.
Google Analytics Reports – Behaviour
Once visited have reached your site, what did they do?
Behaviour Reporting is good to see how visitors are engaging with your website and content. You can use your data to measure the impact of your content and look at ways to improve it to increase audience action.
Here’s a few examples of the kind of data you can expect to see;
- Page Views
- Exit Pages; number of users who exit your site from a page or set of pages
- Landing Pages
- Events; tracking specific interactions on your website (like video plays or pdf downloads)
- Content Drilldown
Google Analytics Reports – Conversions
Did your visitors do what they were supposed to?
Arguably the most important style of report, Conversions will let you know whether your marketing efforts are successful. Visitors doesn’t mean leads. But, conversions do. Use this style to explore your goal conversions; for example, who’s downloading your PDFs, who’s enquiring about your services and so on.
Your Conversions Reports is vital to improve your conversion rate; you need to be able to clearly see what’s a success and equally, what’s a failing.
Your conversion report will be sectioned in to 4 parts;
- Goals
- Ecommerce
- Multi-channel Funnel
- Attribution
1. Goals – Have You Achieved Them?
In order for this section to be relevant, you need to have set up at least one goal. If you want to know how, just visit our previous blog post, “How to Setup Goals with Google Analytics.”
2. Ecommerce – Are You Selling Products?
If your business sells products on their site, this is relevant to you.
In your overview, you can access data like;
- – Average order value
- – Specific purchases
- – How many products you’ve sold
- – Sales Performance; monitors your daily performance
- – Transactions Report; revenue, tax, shipping and so on
- – Time to Purchase; how long visitors took to buy a product after landing on your site
3. Multi-channel – What’s Your Customer’s Journey?
You need to understand exactly what customers are doing on your site. For example, have they read a blog post or downloaded an info-graphic before converting? You’ll be able to discover exactly what content on your site is aiding your conversions.
See how your different channels (like your Social Media pages) work harmoniously to boost your conversion and sales rate.
Your report will be split into categories like …
- – Overview; a brief look at what of your channels are bringing in traffic
- -Assisted Conversions; the interactions consumers took leading up to a conversion, but it was not their final interaction with your site
- – Conversion Path; self-explanatory, it highlights the usual paths consumers take to convert
- – Time Lag; how long it takes for visitors to your website to convert … consumers typically visit a site a few times before converting
4. Attribution – How do Customers Complete a Conversion?
Explore detailing information about the routes your visitors take that lead them to completing a conversion. For example, specific keywords may assist conversions.
The Bottom Line
We haven’t gone in to extensive detail for Google Analytics reports, there’s a lot of different sections and aspects to study. Once you’ve set up your Google Analytics profile, the best thing to do is explore one section at a time and decide what styles of data your primary focus will be.
Contact Different Gravy Digital for Google Analytics Support
Get in touch for a free, no obligation consultation for more information!
Why not check out our Digital Marketing Terms Glossary?
E: contact@differentgravydigital.co.uk
Tel: 0161 706 0004
About the author:
Marie Harwood is a Digital Marketing Assistant at Different Gravy Digital, Hale, Cheshire.
Different Gravy Digital are a full service Digital Marketing Agency operating in the Hospitality & Leisure, Financial Services, Legal & Property sectors. Products and services range from; 3D & 360° Tours, Website Design & Build, Social Media, Video Production, Search Engine Optimisation (SEO), Content Creation, Email Marketing, Online Feedback / Review Systems and Paid Advertising (Google, Bing and Social Media).
Contact Details:
marie@differentgravydigital.co.uk
0161 706 0004
120a Ashley Road, Hale, Altrincham, Cheshire, WA14 2UN